
The State of American Schooling
60 million kids, a trillion dollars a year, and what the numbers actually say.
How many kids ~60 million
There are roughly 60 million young people in school in the United States, between the ages of about three and eighteen.1
Where they go to school 80% district
About 80% of them attend traditional public schools, and another 7% or so attend charter schools.2 The remaining 10% attend either private schools or homeschools, with the great majority in private schools.3
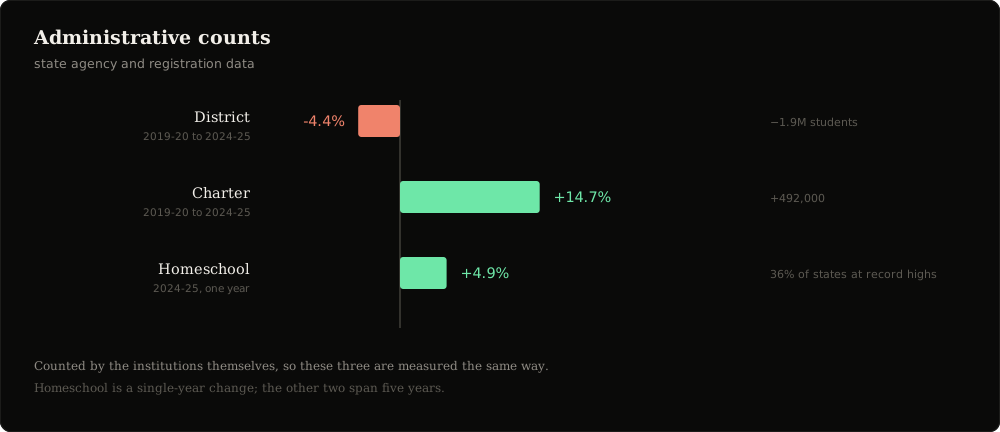
From 2019-20 to 2024-25, district enrollment fell 4.4%, a loss of 1.9 million students, while charter enrollment grew 14.7% over the same five years, a gain of 492,000. Homeschool enrollment grew another 4.9% in 2024-25 alone, double the pre-pandemic rate of 2%, and 36% of states hit their highest ever homeschool enrollment.4
The homeschool total is genuinely contested. Estimates run from about 5.2% of school-age children on the NCES figure to 6.3% on NHERI's, and the spread is mostly an artefact of what each instrument counts: NCES counts students and excludes full-time virtual school, while the Census Household Pulse counts households with at least one homeschooled child, which reads structurally higher.4
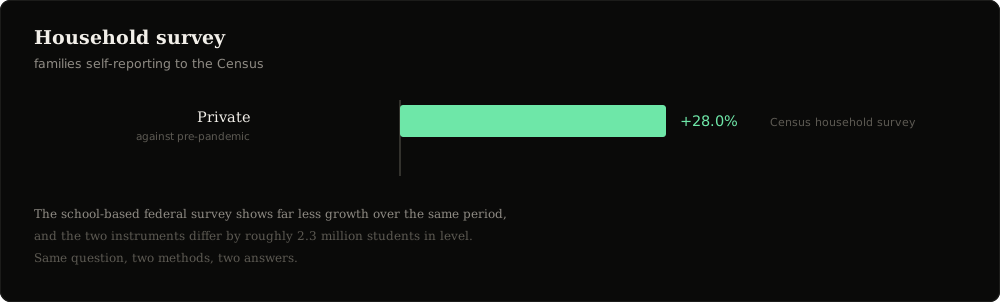
Private enrollment is the hardest to pin down, because the two federal instruments that measure it disagree sharply. The Private School Universe Survey, which asks the schools, counted 4,652,904 private students in 2019-20 and 5,096,365 in 2023-24 — a rise of 9.5%.3 The Census household survey, which asks families, puts the growth at 28% against pre-pandemic numbers.4 The two differ by roughly 2.3 million students in level.
Governance and funding $1T a year
Total government funding into public preK-12 education is just over $1 trillion a year, with roughly 88% coming from state and local government and the other 12% from the federal government. Given that states and localities make most of the calls on how schools operate, that split makes sense.5 The money moves through roughly 13,000 school districts sitting under 50 state legislatures and 50 state education agencies.6
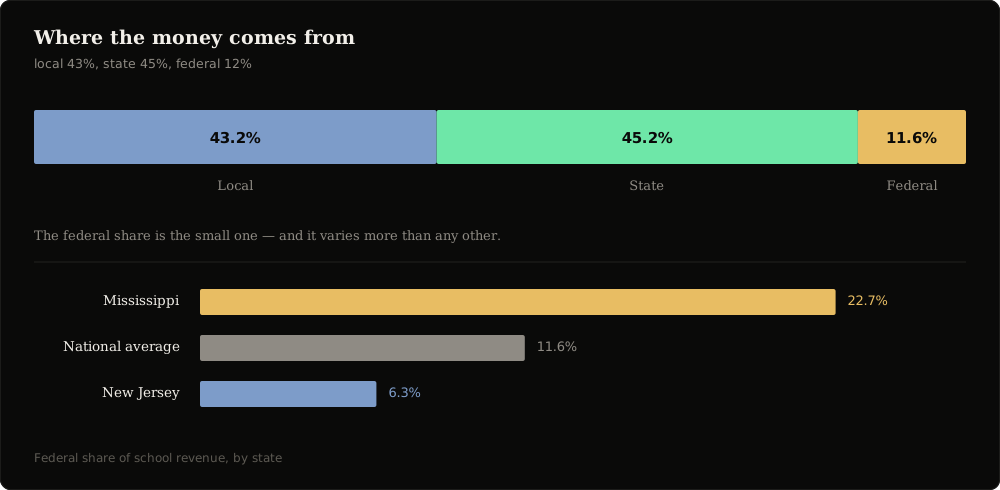
For traditional public schools, funding is roughly 43% from the city, 45% from the state and 12% federal, although this varies significantly by state and district.7
Charter schools also use this government money in the form of per-pupil payments, but must fundraise for the rest of their expenses, including facilities and materials.8 Private schools are mostly funded by tuition, and homeschools are of course funded by the home.
Funding trends 26x since 1920
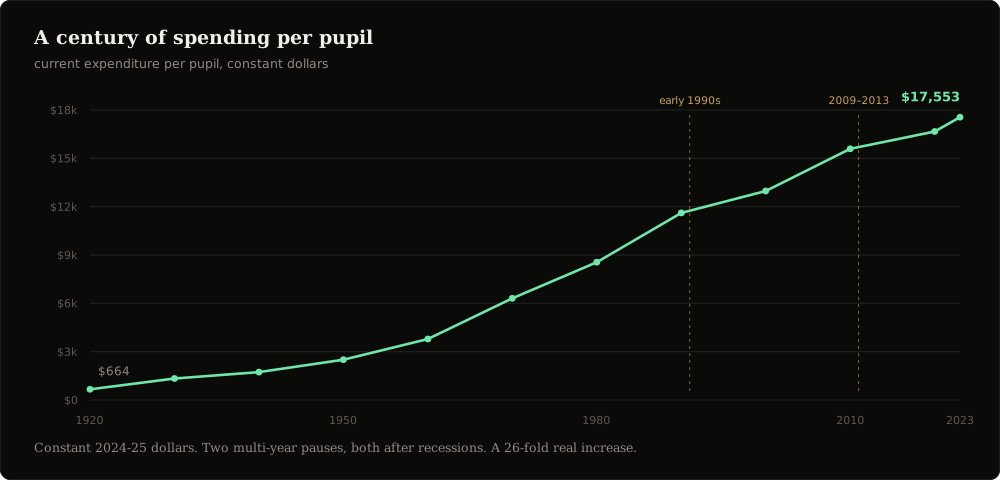
Funding has risen consistently since the 1900s. In 1920, per-pupil spending in today's money was just below $700. Most recently, in 2024, it was tracked at $17,619 per pupil.9
One current change here is education savings accounts and vouchers. Vouchers allow tax money that would go to school districts to be directed instead to other educational institutions by parents, and ESAs are state-funded education savings accounts directed by parents in the interest of their child's education.10
School expenses and spending 79% people
The average student cost is $17,619 on the 2024 Census figure, though this varies by state and city — Los Angeles and New York City run roughly $25,000 and $35,000 respectively.11 12
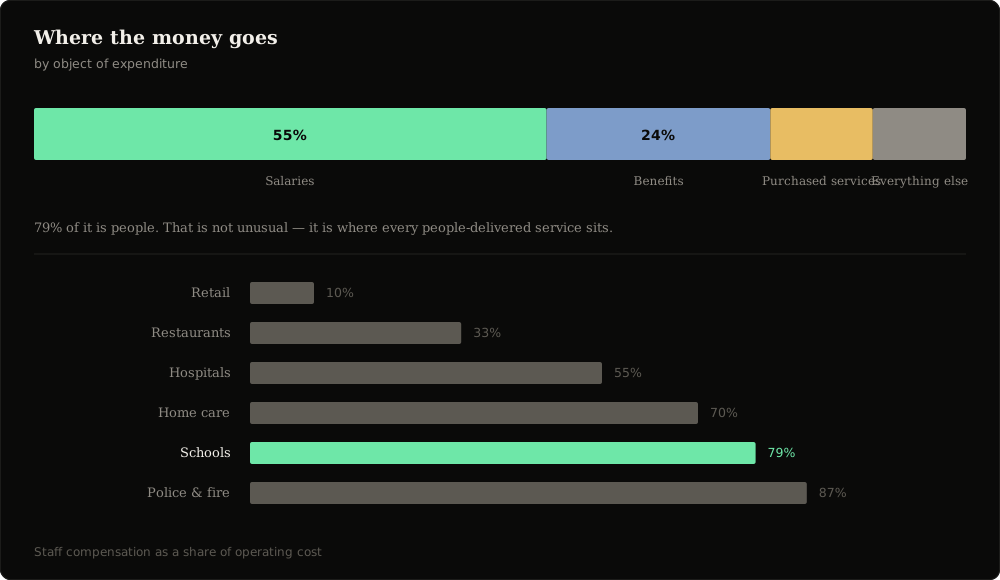
Schools spend on average 79% of their money on salaries and benefits, with the next most significant cost being contracted services like transportation.13
Student academic performance PISA, TIMSS, PIRLS, PIAAC
When you look into student learning performance, no scores are standardised. Not only are there over fifty different tests in use,15 but many of the methodologies used to build them are disagreed upon. There is also no science establishing the upper limits of children's abilities, because we tend to measure what children do rather than what they can do.16 What I will be using instead are tests set relative to other countries, which at least compare different education systems against each other — though most of them do not vary that much.
These tests are either done by age, as with PISA, or by years of schooling, as with the rest.17
PIRLS tests reading in students in their fourth year of schooling. The most recent data is 2021, where the US placed 4th out of the 32 countries that participated with a score of 548. The centre of the scale is 500.18
TIMSS tests maths and science in the fourth and eighth years of schooling. For fourth-grade maths, the most recent data is 2023, where the US placed 22nd out of 63 with a score of 517, in a range running from 362 in South Africa to 615 in Singapore.19 For the science portion the US ranked 12th of 63 with a score of 532.20 On the eighth-grade test the US scored 488, placing 22nd out of the 44 countries that participated.21
PISA is done with 15-year-olds around the world. The most recent data is 2022, where US maths scored 465, below the OECD average of 472, placing 26th out of 81 countries.22 In reading the US placed 6th of 81 with a score of 504 against an average of 476,23 and in science 10th of 81 with a score of 499.24
PIAAC is done with adults from 16 to 65. The most recent data is 2023, where the US on average placed 25th out of 31 in numeracy and close to the average in literacy. On a scale out of 500 the US scored 258 in literacy against an average of 260, 249 in numeracy against an OECD average of 263, and 247 in adaptive problem solving against an OECD average of 251.25
Significantly, 34.2% of US adults are at or below Level 1 in numeracy, the fifth highest share out of the 31 countries tested.26 For scale, Finland leads everything with 296 in literacy, 294 in numeracy and 276 in problem solving, while Chile sits at 218 in literacy.27
As for young people, the 16-24 band performed better than older Americans in literacy with a score of 261, ranking 22nd of 31, but significantly worse in numeracy with a score of 248 and a rank of 29th of 31. No adaptive reasoning score is available for that band.28
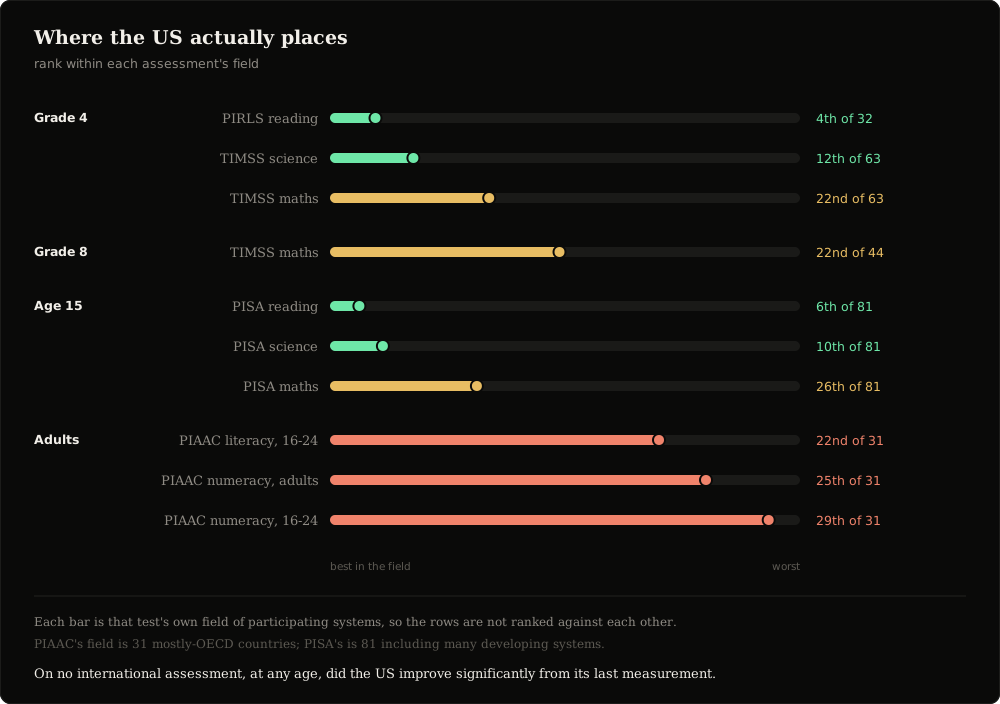
On every test the US either did worse than when it was measured before, or stagnated. On literally no international test did the US, at any age, improve significantly.29
The distribution of the losses what averages hide
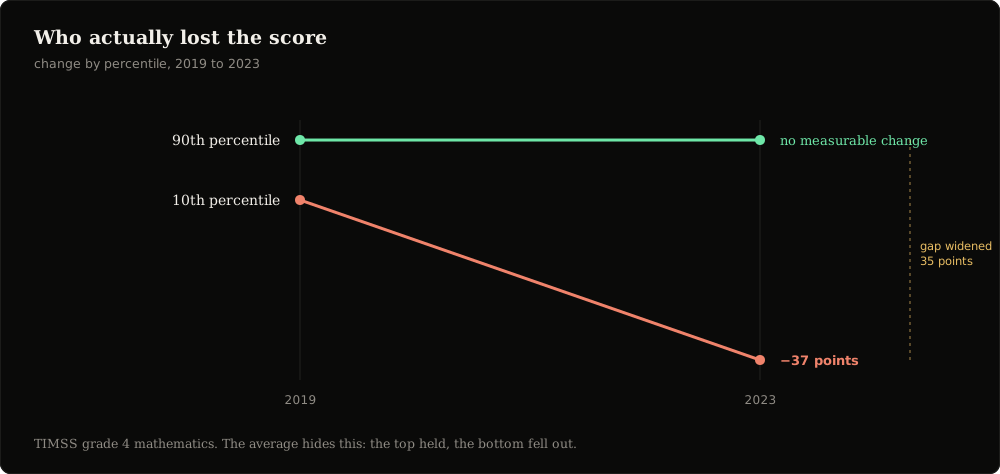
There is a clear pattern in the distribution of performance that I would be remiss not to mention, though it is not at all surprising to me, and that is the loss within certain groups.
Based on the data, children in the top 10 percentiles, although still performing worse, lost less performance than those in the bottom percentiles. The gap widens here as well.30
Time in school 20% of a childhood
Although there is some variation between states in how much time children spend in school, it is generally around 178 days and 1,227 total hours in school, of which typically about 1,000 hours is actual instruction.31 The lowest day count is Colorado at 160 and the highest is Kansas at 186.32 Districts typically determine how much of that time is instructional, which can vary depending on recess, assemblies and other draws on time.
The split of instructional time is heavily favoured towards reading, writing, maths and science, at close to 50% of the time spent on those subjects alone.33 To put that in perspective, it varies a lot by country, with places like Japan and Israel opting for more instructional days but fewer hours per day — around 200 days at roughly four hours.34
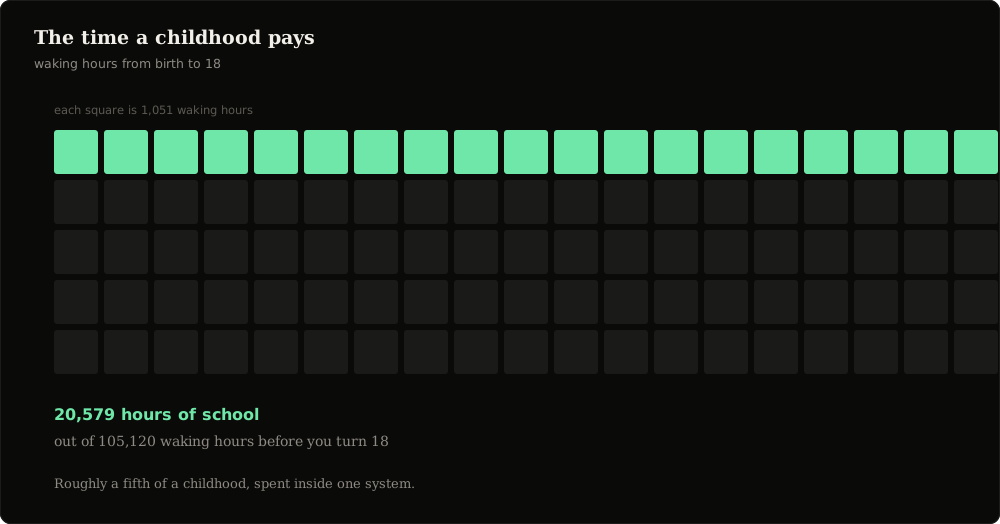
Nonetheless, a child by the age of 18 in the US will have had about 105,120 hours of awake time, assuming eight hours of sleep. That child will have spent about 20,579 hours on school work. Which means that when they graduate at 18 they will have spent 20% of their awake time on school.35
Additionally, we know breaks are important to learning, so I did some research on average recess times in the US. The average amount of time spent at recess, based on surveys, is likely only about 25 minutes. Some states mandate minimums of only 20 minutes, and many have no mandate at all.36 Twenty minutes out of an average six hours of schooling.
Chronic absenteeism 22%
Another piece in the current state of education is absenteeism. Are children attending school consistently?
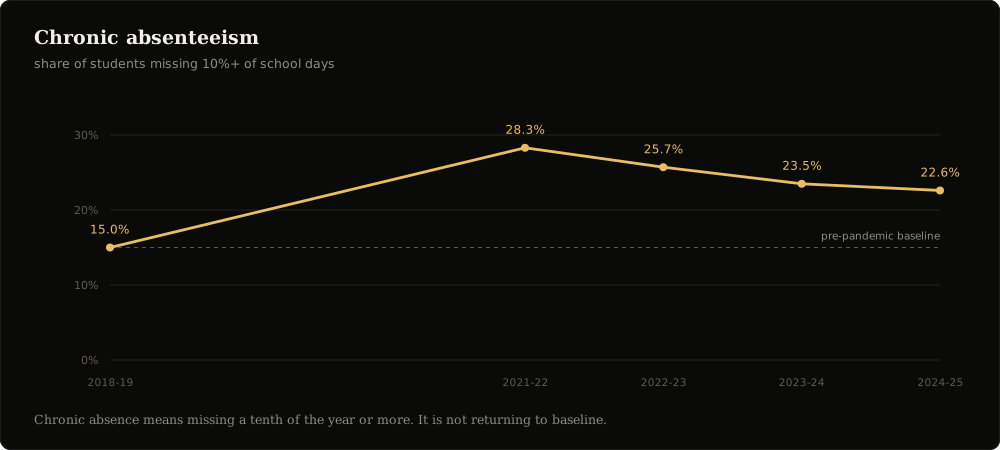
The answer is that almost a quarter, based on the last available data, are not. We know from PISA and other studies that being absent correlates with lower grades, and it is also easy to see the connection between a student's interest and engagement in school and how much they attend.37
Data from AEI and RAND shows that in the 2018-19 school year chronic absenteeism, defined as missing 10% or more of school days, was 15%. Over the following two years during COVID it climbed to 28% and then 26%, before gradually decreasing to 22% in the 2024-25 school year.38
Teachers 1 in 8 uncertified
Another thing I want to look into is teachers. Their salaries are a huge percentage of expenditure in schools, and their teaching methods have huge potential to affect students. They deserve some look into how they are doing and where they are coming from.
After the research, none of this surprised me. Three in four teachers are women, and the average age is 42 with a bimodal distribution — many later in their career and many early.39
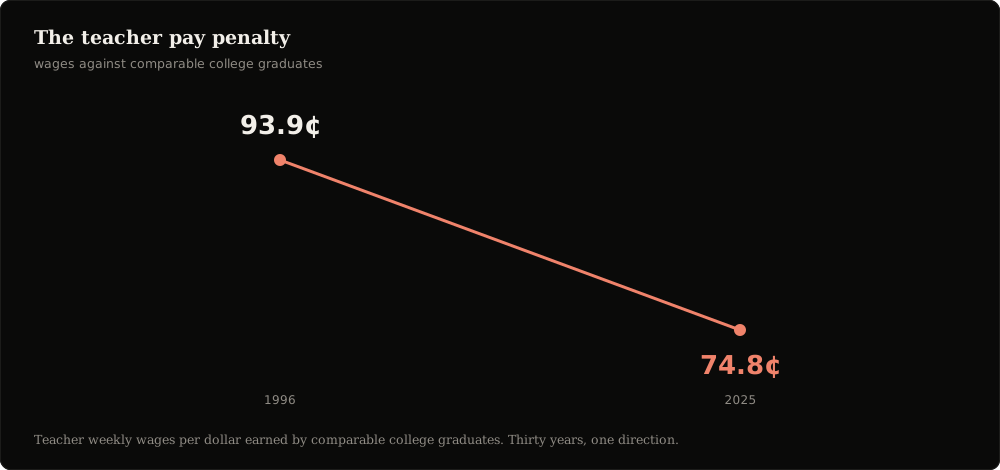
Average starting salary is $48,000 and typically works its way up to around $70,000, plus solid benefits and pension. The caveat is that qualified teachers, meaning those with a degree, certifications and training, still make about 17% worse money including benefits than their peers with the same qualifications.40 41
The number of unqualified teachers is now one in eight around the country.42
A note on qualifications. There is little evidence to support the idea that teachers with qualifications achieve better performance in students than uncertified teachers. What is typically shown to move the needle for traditional teachers is subject-matter knowledge and years teaching, rather than licences or degrees.43
Turnover is around 16%, with 8% every year leaving the teaching field entirely.44 Vacancy is around 1-2%, which is a healthy rate, and it costs between $12,000 and $25,000 to replace a teacher.45
Phonics 2013 onward
Another trend is phonics. From 2013, when Mississippi first implemented policies to use phonics in schools, their children's literacy rank improved dramatically in NAEP, showing significant gains from the beginning of its use up until 2022, where the gains in performance stagnated somewhat.46
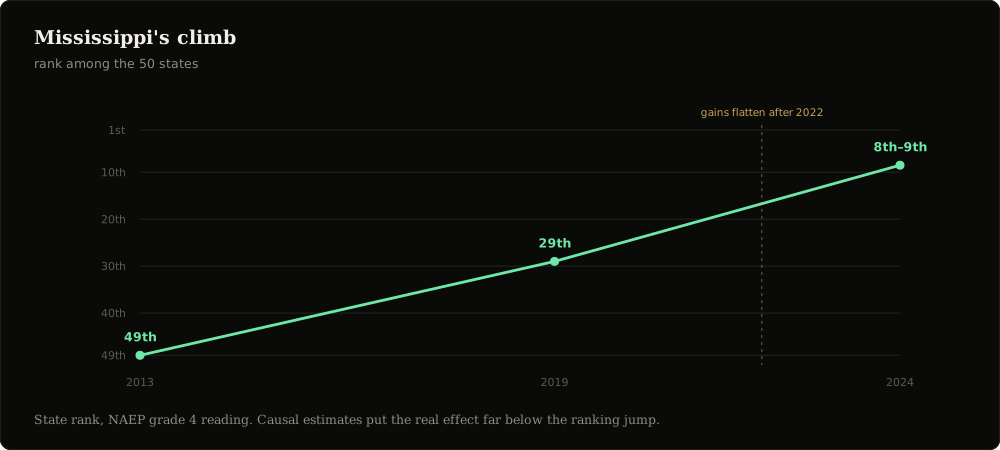
Since Mississippi's dramatic rise in the rankings, 43 states have implemented laws to increase the use of phonics in schools within their jurisdiction.47
Grade inflation GPA up, ACT down
Then there is the separation of GPA from actual performance. One proof of this is ACT's analysis of four million students across 4,800 schools around the country, which found that while students' maths GPAs rose from 3.02 to 3.32, their ACT performance fell from 20.8 on average to 20.3.48
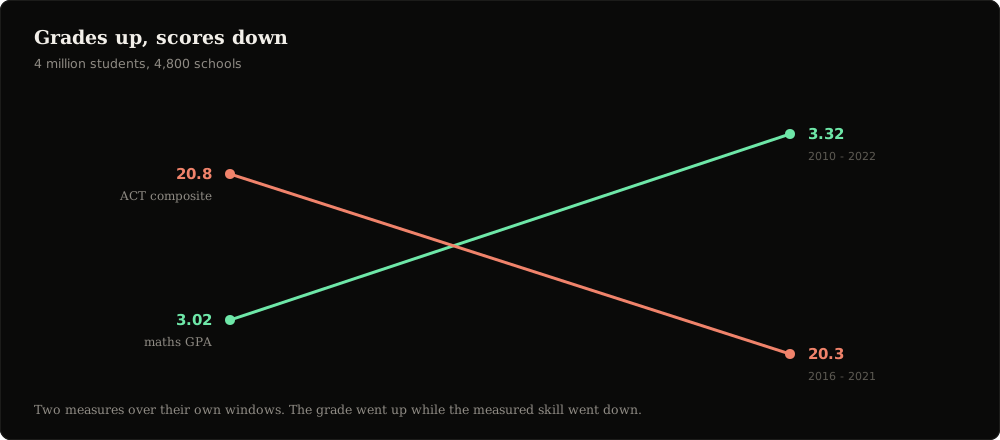
A separate and independent proof is NAEP, which shows student performance on its tests falling while GPA rose. To say it plainly, A students in the past performed better than A students of the present.49
AI and tech adoption 2,982 apps
I would be remiss to miss mentioning AI and technology adoption in schools today, and its effects.
The average school district uses 2,982 different apps in their learning.50 Specific to AI, the usage numbers show anywhere from 54% to 80% of teachers were using AI in 2025, and around the same among students.51
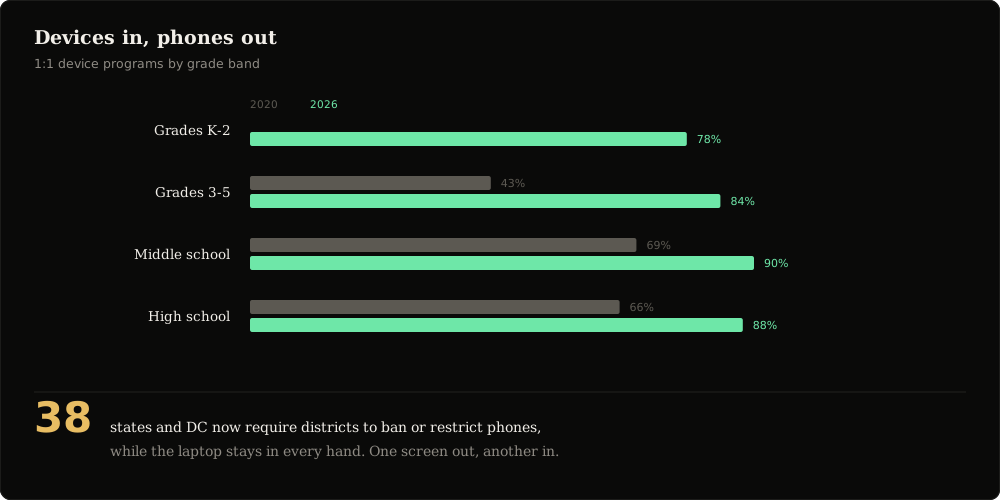
In terms of hardware, 38 states and many districts have banned phones in school, but still use Chromebooks and other laptops.52 Adoption of 1:1 device programmes with laptop-type hardware is close to 88% in high school and around 80% in earlier years.53
Birthrates and the future of school 2028 - 2035
Lastly, I want to talk about the future of school, and the fundamentals of any market or space: supply and demand. At the most basic level there are fewer children now than there were a few years ago, and that trend is continuing downward not only in the US but around the world, with places like South Korea at 64% below the replacement rate.54
While the US population continues to hold at healthy numbers, that is only because of immigration of adults rather than more children being born.55 In the ten-year span from 2010 to 2020, the number of children under five went from 20.2 million to 18.4 million.56
Class sizes through hiring have taken a clear trend, from a 27:1 student-to-adult ratio in 1950 to roughly 15:1 now in traditional schools — but as enrollment falls, hiring must fall as well.57 Studies show some effects from ratio differences, especially at the lower end, but the ratio is not near enough to cause significant positive gains.58
It is worth putting this next to the switching story from earlier, because they are the same story. District schools lost roughly 1.9 million students. Charters picked up about 490,000 of them and private schools about 443,000, on windows that differ by a year. That leaves close to a million students unaccounted for by switching of any kind — and those are children who were never born.
That distinction decides which problem districts actually have. If the losses were pure switching, they have a competition problem, and a better product wins the students back. If a large share is demographic, they have a structural problem that no reform fixes. On these numbers it is roughly half and half, which means both are true at once and only one of them is solvable by getting better.
The falling birthrate is also affecting enrollment in schools. In 2019 enrollment peaked at 50.8 million children in public school; as the years continued, enrollment dropped off to 49.4 million in 2024 at the most recent count.59 It is forecast to drop 8% by 2030,60 and because there are fewer people having fewer babies, this will compound.
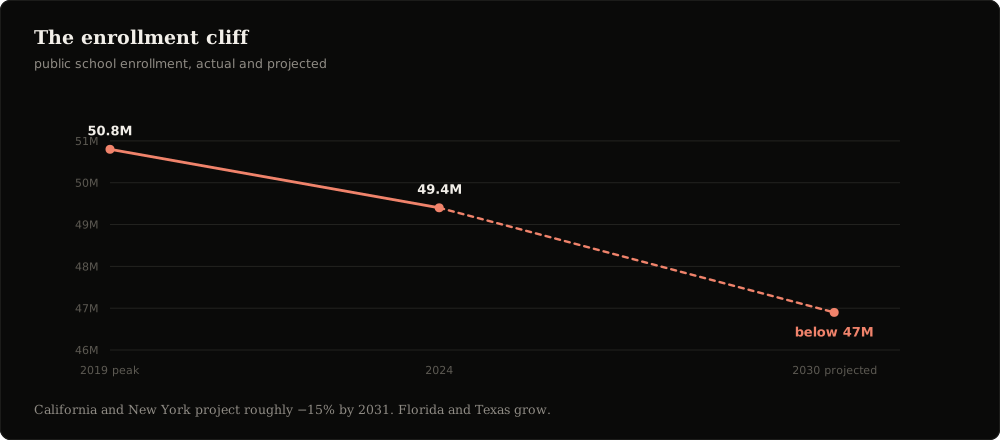
The problem here is that children are revenue for schools. If schools are losing full percentages of revenue, they must also cut full percentages of expense, which is considerably harder with facilities and other static costs. Additionally, there continue to be more children with disabilities and more children who need to learn English, increasing the cost per student for every district where that is true.61
The cliff is also less hypothetical than the projection makes it sound, because it has already landed in the lower grades. Since fall 2019, PK-8 enrollment has fallen 4.5% to 33.9 million, while grades 9-12 actually rose 2%, from 15.2 million to 15.6 million.75 The high schools are still full of children born before the decline. The elementary schools are not, and that gap works its way upward one year at a time.
These problems are a few years out for the US, so why mention them? Because of what is happening in Asia right now.
In Japan, 1.2 schools a day are closing, and the country has been below a replacement birthrate since 1974.62 This problem gets worse, and we know what happens there. Korea is the same. There are significantly fewer students, and the number of schools enrolling zero first graders is up 81%.63
Summary and insights the takeaways
As a reflection, I see much of this as negative. As an optimist and an entrepreneur, I see it as a huge opportunity.
- Time is a tax, and it is paid disproportionately. Taxes are not the only thing paid disproportionately by the middle and lower classes, due to their lower status and know-how with tax offsetting. Time, through school, is also paid as a tax, at close to the same total effective rate — 20-30% of a child's life, or 20-30% of an adult's income.64
- The report card no longer describes the product. It is clear to see that while GPAs are improving, the actual academic performance of US students is decaying, which puts a lot of weight on reporting systems that are not carrying it.65
- Learning science has traction, not just potential. Implementation of learning and motivation science into the school system has huge potential, because of the way the use of phonics in Mississippi inspired action across the nation.66
- Teachers are not one of the worst paid professions. That myth is disproven by this data. While they are making worse money on average than their peers from college, they are making about the average wage in many places.67
- The system has no quality feedback loop. It cannot yet improve, because it is not even measured effectively. There is no test applied nationally by our country, and the current systems like GPA are inflated. Critics may say NAEP is that test, but its standards are both controversial and hold no backing. Although it is federally run to balance the states, it carries no consequences and is only ever a sample of students rather than everyone.68
- We are roughly a generation behind Korea and Japan. Around 2028 to 2035 is when enrollment decay in US schools will accelerate to more obvious effect, as it is in Asia. That makes the most volatile period in the history of America's education system one that is coming soon — and makes now one of the greatest times to start building, as the market softens to better solutions.69
- People are already leaving. Absenteeism and private enrollment are increasing similarly, which signals disengagement from the current system.70
- Satisfaction is falling and merit is being noticed. 35% of people in the US are satisfied with the public education system, and it is decreasing: 8% fewer people are satisfied with public school this year than in 2024, per Gallup.71 More and more people are realising that competing for merit matters.72 And there are huge advances in our understanding and ability to teach children well, given that learning science really began roughly only 60 years ago.73
- More money has not bought better results. Even as we put more money into the education system, our scores continue to fall.74
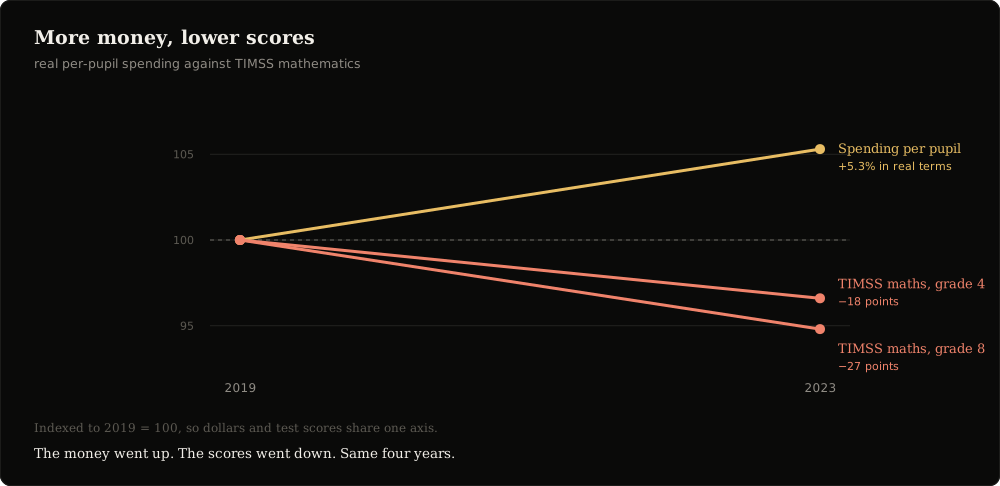
That last one is the one I keep coming back to. It means the system is broken. Just like the machine of a car that many of us drive, at some point it is best to call it a total loss.
Last but not least, we have a chance to change this course. While birthrates are falling and our students are less capable, there will be greater and greater malleability in the education system.
In changing our education system, we have the opportunity to uproot the practices that got us here. What has gotten us here cannot get our society out.
Sources74 references — tap to open
- NCES Condition of Education, public preK-12 enrollment 49.4 million in fall 2024; Census Bureau puts K-12 at 54.1 million for 2025-26. nces.ed.gov/programs/coe/indicator/cga/public-school-enrollment
- Public enrollment 49.4 million in fall 2024; charters roughly 7% of public enrollment. FutureEd. www.future-ed.org/k-12-public-school-enrollment-declines-explained
- NCES Private School Universe Survey (PSS), a biennial census of US private schools: 4,652,904 students in 2019-20 and 5,096,365 in 2023-24, a rise of 9.5%. Characteristics of Private Schools in the United States: Results From the 2023-24 Private School Universe Survey, NCES 2026-015. nces.ed.gov/use-work/resource-library/report/first-look-ed-tab/characteristics-private-schools-united-states-results-2023-24-private-school-universe-survey
- National Alliance for Public Charter Schools: nearly 4 million charter students in more than 8,100 schools in 2024-25, up 492,000 or 14.7% since 2019-20, while district enrollment fell 4.4% or over 1.9 million. Johns Hopkins Homeschool Hub: homeschool enrollment up 4.9% in 2024-25, with 80% of reporting states growing and 36% at all-time highs. NHERI puts homeschooling at 6.3%, NCES at 5.2%. publiccharters.org/annual-reports · education.jhu.edu/edpolicy/policy-research-initiatives/homeschool-hub/homeschool-growth-2024-2025 · nheri.org/how-many-homeschool-students-are-there-in-the-united-states
- Census Bureau, Annual Survey of School System Finances: $994.9 billion total K-12 revenue in FY2024; state and local 88%, federal 11.6%. www.census.gov/newsroom/press-releases/2026/school-system-finances.html
- K-12 is just over a fifth of all state and local direct general government spending, the largest non-federal expenditure category. Census Bureau.
- Census Bureau FY2024: local $429.8 billion or 43.2%, federal 11.6%, state the remainder. Property taxes are 63.3% of local revenue. Federal share ranges from 22.7% in Mississippi to 6.3% in New Jersey. www.census.gov/newsroom/press-releases/2026/school-system-finances.html
- Charter schools receive per-pupil operating money but little or no facilities funding in most states. School-finance literature.
- NCES Digest table 236.55, current expenditure per pupil in constant 2024-25 dollars: 1919-20 $664, 1929-30 $1,334, 1939-40 $1,733, 1949-50 $2,502, 1959-60 $3,787, 1969-70 $6,315, 1979-80 $8,550, 1989-90 $11,616, 1999-00 $12,974, 2009-10 $15,592, 2019-20 $16,667, 2022-23 $17,553. nces.ed.gov/programs/digest/d25/tables/dt25_236.55.asp
- Iowa pays $8,148 per ESA for 2026-27. Texas launched at up to roughly $10,000 and drew more than 100,000 applications in under two weeks. Arizona passed 100,000 enrolled in January 2026. Roughly 19 states have universal eligibility. EdChoice.
- Census Bureau: current spending per pupil rose 6.6% from $16,526 in FY2023 to $17,619 in FY2024. Highest New York $31,918 and DC $31,529; lowest Idaho $11,060 and Utah $11,347. www.census.gov/newsroom/press-releases/2026/school-system-finances.html
- Census Bureau FY2024, 100 largest districts: New York City $35,796, Los Angeles Unified $25,631. www.census.gov/newsroom/press-releases/2026/school-system-finances.html
- Census Bureau FY2024 by object: salaries roughly 55%, benefits roughly 24%, purchased services about 11%. Instructional salaries alone $291.8 billion. OECD Education at a Glance puts staff compensation at 79% of current expenditure across member countries. www.census.gov/newsroom/press-releases/2026/school-system-finances.html · www.oecd.org/en/publications/education-at-a-glance-2025_1e02ff40-en/full-report/component-52.html
- 50 state accountability systems plus DC, NAEP, and PIRLS, TIMSS, PISA and PIAAC.
- NAEP achievement levels were set by National Assessment Governing Board panels in 1993 and have been criticised by the National Academies, the National Academy of Education and the GAO.
- PISA samples by age, testing 15-year-olds. TIMSS and PIRLS sample by years of schooling. nces.ed.gov/surveys/pisa/overview.asp · nces.ed.gov/surveys/pirls
- PIRLS 2021: US score 548 against a scale centrepoint of 500, higher than 24 of 32 paper-reporting systems and lower than 3. 65 education systems participated overall. nces.ed.gov/surveys/pirls/pirls2021/index.asp
- TIMSS 2023, 63 education systems at grade 4: US maths 517, down 18 points from 2019 and the lowest since 1995. Range from 362 in South Africa to 615 in Singapore. ies.ed.gov/learn/press-release/mathematics-scores-u-s-fourth-and-eighth-graders-decline-international-mathematics-and-science
- TIMSS 2023: US grade 4 science 532, higher than 39 systems, not measurably different from 12, lower than 11. nces.ed.gov/timss/results23/doc/TIMSS2023_compiled.pdf
- TIMSS 2023, 45 education systems at grade 8: US maths 488, down 27 points from 2019. ies.ed.gov/learn/press-release/mathematics-scores-u-s-fourth-and-eighth-graders-decline-international-mathematics-and-science
- PISA 2022, 81 countries and education systems: US maths 465 against an OECD average of 472, with 25 systems higher. Lowest US maths score in PISA history. nces.ed.gov/surveys/pisa/pisa2022
- PISA 2022: US reading 504 against an average of 476, with 5 systems higher. nces.ed.gov/surveys/pisa/pisa2022
- PISA 2022: US science approximately 499, with 9 systems higher. nces.ed.gov/surveys/pisa/pisa2022
- PIAAC 2023: US literacy 258 against an international average of 260, numeracy 249 against 263, adaptive problem solving 247 against 251. ies.ed.gov/learn/press-release/u-s-adults-score-par-international-average-literacy-skills-below-international-average-numeracy-and
- PIAAC: US low performers in numeracy rose from 29% in 2017 to 34.2% in 2023, the fifth highest share of the 31 countries tested. ies.ed.gov/learn/press-release/u-s-adults-score-par-international-average-literacy-skills-below-international-average-numeracy-and
- PIAAC 2023: Finland 296 literacy, 294 numeracy, 276 adaptive problem solving. Japan tied at 276 in problem solving. Chile 218 in literacy.
- PIAAC 2023, US ages 16-24: literacy 261 ranking 22nd of 31, numeracy 248 ranking 29th of 31. nces.ed.gov/surveys/piaac/snapshots.asp
- Scoped to international assessments. NAEP's 2025 long-term trend release found nine-year-olds gained in reading and maths from 2022 to 2025. www.nationsreportcard.gov/highlights/ltt/2023
- TIMSS 2023 against 2019 at grade 4: the 10th percentile fell 37 points in maths and 22 in science while 90th percentile scores were not measurably different. Gaps widened 35 points in maths and 26 in science. At grade 8 top performers fell 29 points against 19 for low performers. Since 2012, 13-year-olds' maths dropped 7 points at the 90th percentile against 27 at the 10th. ies.ed.gov/learn/press-release/mathematics-scores-u-s-fourth-and-eighth-graders-decline-international-mathematics-and-science · www.educationnext.org/putting-pandemic-learning-loss-in-perspective-achievement-declines-21st-century-america-naep
- 6.87 hours a day across 178.71 days is 1,227 hours in session. Pew Research Center; Education Commission of the States. www.pewresearch.org/short-reads/2023/09/07/in-the-u-s-180-days-of-school-is-most-common-but-length-of-school-day-varies-by-state · www.ecs.org/50-state-comparison-instructional-time-policies-2023
- Colorado 160 days lowest, Kansas 186 for K-11 highest. Of the 37 states setting a minimum day count, 28 set it at 180. Hour minimums run from 720 in Arizona to 1,260 in Texas. Education Week. www.edweek.org/policy-politics/which-states-require-the-most-and-least-instructional-time-find-out/2024/12
- OECD figure for primary compulsory instruction time. OECD excludes the US from its instruction-time tables because time is set at state and district level.
- OECD Education at a Glance: instructional days range from 162 in France to over 200 in Israel and Japan. OECD averages 804 hours in primary and 922 in lower secondary across 38 weeks.
- 18 years at 365 days and 16 waking hours is 105,120 hours. 20,579 hours is roughly 15 years at 1,227 hours plus about 2,200 hours of homework, or 19.6% of waking time.
- No systematic national collection exists. Survey self-report puts elementary recess at 25-30 minutes; about ten states mandate a minimum, commonly 20 minutes.
- PISA background questionnaires collect absence data and report its association with achievement. nces.ed.gov/surveys/pisa/overview.asp
- AEI Return to Learn Tracker across 45 states: 15% in 2018-19, 28.3% in 2022, 25.7% in 2023, 23.5% in 2024, 22.6% in 2025. RAND puts 2024-25 near 22%, or 10.8 million students, with more than 30% chronically absent in roughly half of urban districts. www.aei.org/research-products/report/from-attendance-crisis-to-chronic-condition-tracking-post-pandemic-chronic-absenteeism-into-2025 · www.rand.org/pubs/research_reports/RRA956-34.html
- NCES National Teacher and Principal Survey: 77% women, mean experience about 14 years. Between 2011-12 and 2020-21, teachers with 3-9 years of experience fell from 33% to 29% while those past 20 years rose from 23% to 26%. nces.ed.gov/programs/coe/indicator/clr/public-school-teachers
- NEA: average starting salary $48,112 for 2024-25; national average $65,090 in 2020-21, with New York highest at $87,738.
- EPI and CEPR: total compensation gap 17.1% in 2024. Wage-only penalty 25.2% in 2025, or 74.8 cents on the dollar against comparable college graduates, down from 93.9 cents in 1996. By gender, 34.5% for men and 20.0% for women. Range from 10.4% in Rhode Island to 40.7% in Colorado. www.epi.org/publication/the-teacher-pay-penalty-remained-high-in-2025-teachers-and-students-nationwide-are-still-paying-the-price-of-decades-of-neglect
- Learning Policy Institute 2025: 365,967 teachers not fully certified plus 45,582 vacancies, about one in eight positions. Schools with the highest concentrations of students of colour are four times as likely to employ an uncertified teacher. learningpolicyinstitute.org/product/overview-teacher-shortages-2025-factsheet
- Mathematica's randomised studies found alternative-route teachers matched or beat certified teachers in maths. Clotfelter in North Carolina and Boyd in New York City find teachers on emergency or temporary credentials produce smaller gains.
- NCES Teacher Follow-up Survey 2021-22: 84% stayers, 8% movers, 8% leavers among public school teachers, statistically unchanged from 2012-13. Private school leaver rate 12%. Turnover 35-37% higher in the highest-poverty schools. ies.ed.gov/learn/press-release/eight-percent-public-school-teachers-left-teaching-2021-rate-unchanged-last-measured-2012
- Learning Policy Institute: 45,582 vacancies against roughly 3.2 million teachers, about 1.4%. Replacement costs $12,000-$25,000 depending on district size. learningpolicyinstitute.org/product/overview-teacher-shortages-2025-factsheet
- Mississippi's Literacy-Based Promotion Act, 2013, funded statewide literacy coaching, required teacher training, and added K-3 screening and third-grade retention. Mississippi ranked 49th of 50 in NAEP grade 4 reading in 2013, 29th by 2019, roughly 8th-9th by 2024; grade 4 proficiency rose 11 points from 2013 to 2024 while the national average fell 4. Gains negligible from 2022 to 2025. Causal estimates put the effect at roughly 5 NAEP points. Spencer, Journal of Public Economics. www.sciencedirect.com/science/article/abs/pii/S027277572400092X · mississippitoday.org/2026/05/13/reading-mississippi-gains-pandemic
- As of August 2026, 43 states and DC have passed laws or implemented new policies on evidence-based reading instruction since 2013. Education Week. www.edweek.org/teaching-learning/which-states-have-passed-science-of-reading-laws-whats-in-them/2022/07
- ACT analysed more than 4 million students across roughly 4,800 schools. Maths GPA rose from 3.02 to 3.32 over 2010-2022. Overall GPA rose from 3.22 to 3.39 while the ACT composite fell from 20.8 to 20.3 over 2016-2021. By 2022 more than 89% of high schoolers received an A or B in maths, English, social studies and science. industryinsights.act.org/2023/08/grade-inflation-math · hechingerreport.org/proof-points-new-evidence-of-high-school-grade-inflation
- NAEP transcript data: high school graduates averaged 3.11 GPA in 2019, up from 3.00 in 2009 and 2.68 in 1990, while grade 12 NAEP maths declined. Grade inflation was more pronounced in higher-poverty schools and among lower-income students. www.nationsreportcard.gov
- LearnPlatform by Instructure, EdTech Top 40 for 2024-25: districts accessed an average of 2,982 distinct edtech tools annually, up nearly 9% year over year. Students used 48 unique tools and educators 50. www.instructure.com/press-release/new-learnplatform-instructure-report-shows-k-12-districts-are-more-selective-about
- RAND: 53% of teachers in 2024-25, double the prior year's 25%. Center for Democracy and Technology: 85% of teachers and 86% of students. Pew: 64% of teens aged 13-17 use AI chatbots, 54% for schoolwork. A 2025 review of 28 studies covering nearly 5,000 K-12 students found positive effects from AI tutoring but negligible advantage over non-AI tutoring using the same active-learning approach. www.scientificamerican.com/article/alpha-schools-ai-teaching-model-is-expanding-does-it-work
- As of June 2026, 38 states and DC require districts to ban or restrict phone use. Bell-to-bell counts: Ballotpedia 26, Education Week 30. Roughly 8 states restrict instructional time only. www.k-12legalinsights.com/2026/08/screening-screen-time-more-states-are-implementing-cell-phone-bans-in-k-12-schools
- CoSN 2026 State of Ed Tech: one-to-one device programmes at 78% of districts for K-2, 84% for grades 3-5, 90% middle school, 88% high school, up from 43% elementary, 69% middle and 66% high in 2020. www.k12dive.com/news/most-districts-now-have-11-device-programs-pushback-finances-could-chang/819884
- Korea's total fertility rate: 0.72 in 2023, 0.75 in 2024, 0.8 in 2025, against 2.1 replacement.
- US total fertility rate fell to 1.599 in 2024, an all-time low, from 2.1 in 2007. Births rose 1% in 2024 to 3,628,934 as the childbearing-age population grew. CDC/NCHS Data Brief 535. www.cdc.gov/nchs/products/databriefs/db535.htm
- Census Bureau: under-5 population fell from 20.2 million in 2010 to 18.4 million in 2020.
- NCES Digest table 208.20: pupil-teacher ratio 26.9 in 1955, 17.9 by 1985, 15.3 by 2008, roughly 14.7 today. NTPS puts average class sizes at roughly 19 for self-contained elementary and 21-22 at middle and high school. nces.ed.gov/programs/digest/d22/tables/dt22_208.20.asp
- Project STAR, Tennessee 1985-89, over 11,000 students across 79 schools with students and teachers randomised, found gains from classes of 13-17 versus 22-25, largest for low-income and minority students. Hanushek's review of roughly 300 estimates finds no average effect.
- Public school enrollment fell from 50.8 million in fall 2019 to 49.4 million in fall 2024, more than 1.4 million students or 2.8%. FutureEd. www.future-ed.org/k-12-public-school-enrollment-declines-explained
- NCES projects an 8% decrease in total public and private enrollment between fall 2019 and fall 2030, with public enrollment below 47 million by 2030-31. California and New York project roughly −15% by 2031 while Florida and Texas grow. nces.ed.gov/programs/PES/section-1.asp
- English learner and students-with-disabilities enrollment are both rising in absolute number and as a share of enrollment.
- Japan closes roughly 450 schools a year, 8,850 between 2004 and 2023, about 1.2 per day. Births fell below 800,000 in 2022. ABC News. www.abc.net.au/news/2023-04-02/school-closures-spread-in-ageing-japan-depopulation/102173368
- 210 Korean elementary schools enrolled zero first-graders in 2026, up from 116 five years earlier, an 81% increase. First-grade enrollment fell 15.5% in two years, from 353,000 to 298,178. Total K-12 falls from 5.01 million in 2025 to 4.83 million in 2026, projected below 4 million by 2031 against a 1993 peak of 8.82 million. Korea Herald. www.koreaherald.com/article/10654499
- Waking-hours calculation at note 35; distribution of losses at note 30.
- ACT and NAEP grade inflation evidence at notes 48 and 49.
- Mississippi results and the 43-state response at notes 46 and 47.
- NEA pay figures at note 40; EPI pay penalty at note 41. US median individual earnings roughly $48,000; BLS median wage across all occupations lower than the teacher average.
- NAEP is administered by the National Center for Education Statistics, with content and achievement levels set by the National Assessment Governing Board. It samples rather than testing every student and carries no consequences. www.nationsreportcard.gov · www.nagb.gov
- Fertility at note 55, enrollment at notes 59 and 60, Japan and Korea at notes 62 and 63.
- Chronic absence at note 38; charter and homeschool growth at note 4.
- Gallup: 35% of Americans satisfied with the quality of US K-12 education, down 8 points from 43% in 2024 and a record low across 26 years of polling. Parent satisfaction with their own child's education 74%, against a 26-year average of 76%. news.gallup.com/poll/695174/record-low-satisfied-education-quality.aspx
- Charter enrollment up 492,000 while district fell 1.9 million; homeschool at all-time highs in a third of reporting states; Texas drew 100,000+ ESA applications in under two weeks. Notes 4 and 10.
- Miller on memory capacity 1956; Neisser's Cognitive Psychology 1967; Atkinson-Shiffrin memory model 1968. Ebbinghaus published the forgetting curve and the first spacing experiments in 1885. The National Reading Panel reported in 2000.
- NCES Digest table 236.55, current expenditure per pupil in constant 2024-25 dollars: $16,667 in 2019-20 and $17,553 in 2022-23, a real increase of 5.3%. TIMSS 2023 against 2019: grade 4 maths fell 18 points and grade 8 maths fell 27 points. 2019 scores are the 2023 results plus those declines. nces.ed.gov/programs/digest/d25/tables/dt25_236.55.asp · ies.ed.gov/learn/press-release/mathematics-scores-u-s-fourth-and-eighth-graders-decline-international-mathematics-and-science
- Since fall 2019, PK-8 enrollment fell 4.5% to 33.9 million while grades 9-12 rose 2%, from 15.2 million to 15.6 million. NCES; FutureEd. www.future-ed.org/k-12-public-school-enrollment-declines-explained